Opening Candle High/Low with Time Zone and Minute Offset
Title: Opening Candle High/Low with Time Zone and Minute Offset
Description:
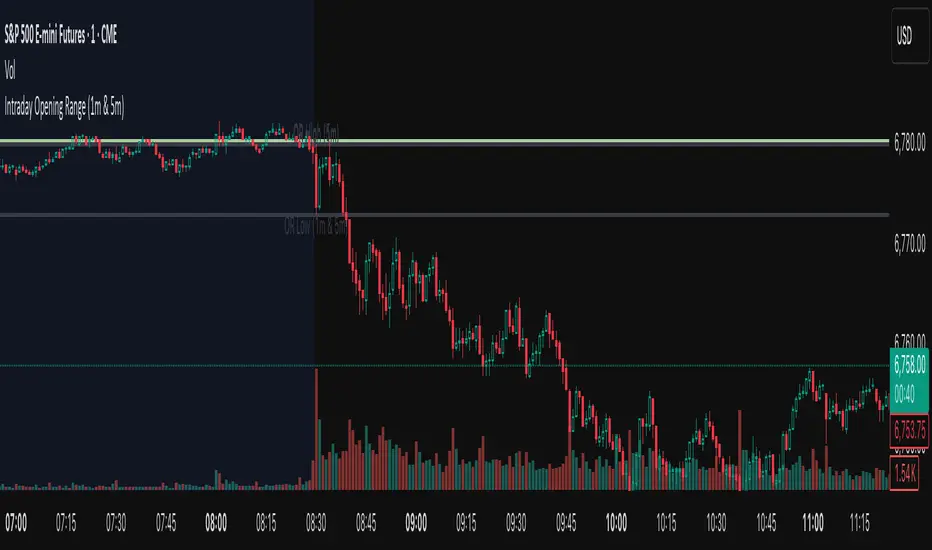
The Opening Candle High/Low with Time Zone and Minute Offset indicator is a versatile tool that highlights the high and low of the first candle of the trading session, adjusted for your preferred time zone and minute offset. It is particularly useful for traders who focus on opening ranges as key reference points for their trading strategies.
---
Features:
1. Time Zone and Minute Adjustment:
- Allows customization of the start time by applying a time zone offset (in hours) and a minute offset.
- Ideal for traders operating in different time zones or trading sessions that don't align with midnight UTC.
2. Dynamic First Candle Detection:
- Automatically captures the high and low of the first candle after the adjusted time.
- Resets daily, ensuring accurate levels for each new trading session.
3. Visual Representation:
- Plots the high and low levels of the first candle directly on the chart for easy reference.
- Uses distinct colors (green for the high and red for the low) and adjustable line widths for clarity.
4. Simplicity and Versatility:
- Works across all markets and timeframes, providing essential information for opening range breakout strategies, support/resistance analysis, or session-based trading.
---
How It Works:
1. Time Adjustment:
- The indicator adjusts the current chart time by applying the user-defined hour and minute offsets.
- This ensures the "opening candle" aligns with your specific trading session requirements.
2. First Candle Detection:
- When the adjusted time matches the start of a new day (midnight with offsets), the indicator captures the high and low of the first candle.
- These values are stored and remain static throughout the trading day.
3. Plotting:
- The high and low levels of the opening candle are plotted on the chart, providing visual reference points for traders.
---
Use Case:
- This indicator is ideal for traders who rely on the opening range of a session for planning trades, such as breakout or reversal strategies.
- It can also serve as a key tool for identifying significant price levels in session-based trading.
Simplify your trading analysis and align your strategy with this customizable and intuitive indicator.
Penunjuk Pine Script®